Sonoma County Country Property Home Prices on the Rise
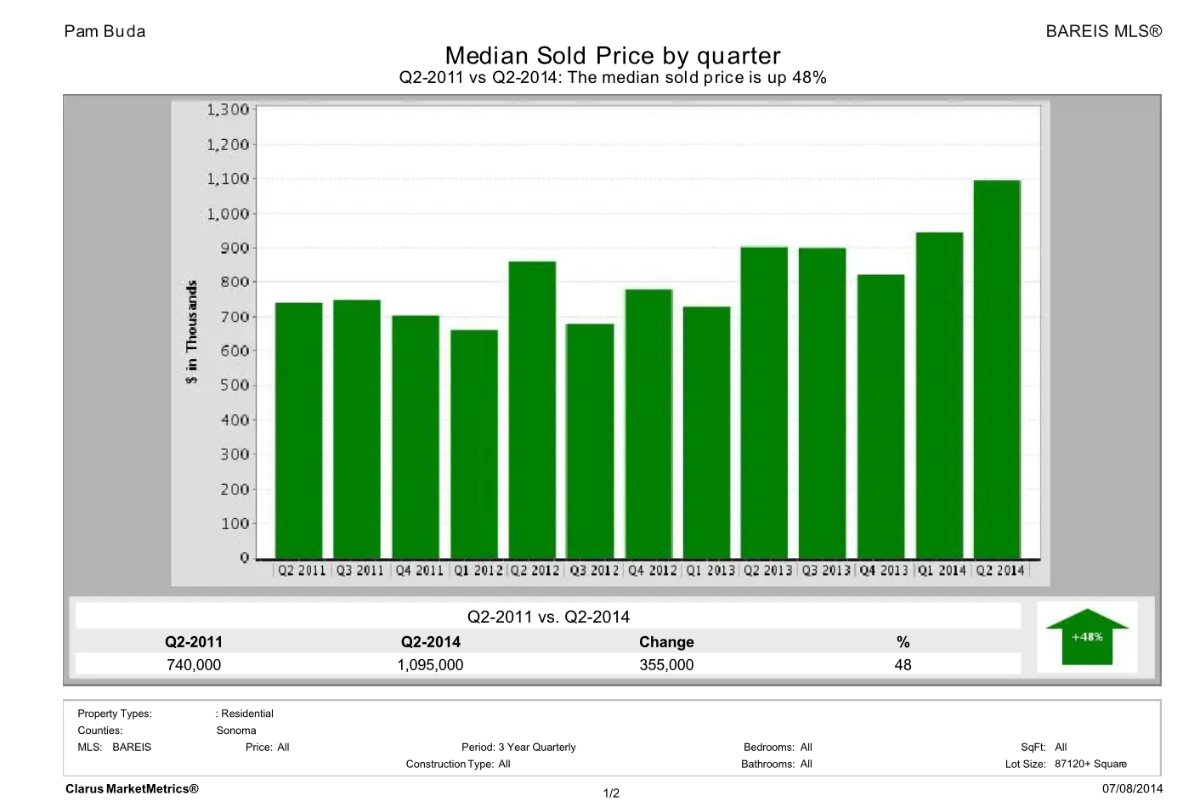
Today the median Sonoma County country home price with two acres or more is $1,095,000. While you will find country homes listed in the 6oo-800,000 range there is a good bet that there will be multiple buyers lined up for each one and sales prices are exceeding list prices in many cases, some times dramatically....
Happy Thanksgiving from Sonoma County's Wine Country
Thanksgiving greetings from Pam Buda, Realtor in Sonoma County to her friends, colleagues and clients. Besides loving life and work in the wine country, the improved real estate market inspires additional gratitude....
Median Sonoma County Home Price Rises 25% in the Last Year
Here are the latest charts for residential real estate market statistics in Sonoma County. They represent market data from the BAREIS Multiple Listing Service as displayed by Clarus MarketMetrics. The continuing big story is the 25% rise in the median home price versus October of 2012. This is a direct result of actual appreciation in home values as well as an increase in the number of higher priced homes being sold. It does not mean that every home has appreciated 25% in value--just that the overall mix of homes sold lands at that higher value. At the lower (sub $500,000 ) price ranges, in some cases appreciation might have been as high at 28%, whereas at the upper end the appreciation is more modest, but the rate of sales has increased greatly. I have attended a few economic forecast meetings this fall and the "experts" think we will see more modest appreciation in 2014, more in the neighborhood of 6%. This probably makes some sense as the overall mix of types of homes may have stabilized so there will be less of a bump from that change. Although last year I believe the same experts predicted 5-8% appreciation for 2013 so who knows? Bottom line if you have questions about your specific situation, whether buying, or selling, or just sitting pat but curiuos, give me a call or pop me an email and I will be happy to research it for you! Sonoma County Home Salest Report October 2012 through October 2013 by Pam Buda...
Median Home Price in Sonoma County Up $100,000 in last year
[caption id="attachment_1925" align="alignleft" width="300"] The Sonoma County market for homes appears headed in the right direction if you are selling.[/caption] I figured that headline might grab your attention whether you are a Sonoma County home buyer (feeling panic!) or a Sonoma County home seller (feeling excitement!) You can click through the link below to access the full Sonoma County Home Sales Report as of June 1, 2013. We look at sales statistics for Sonoma County as a whole because the sample sizes for the smaller towns such as Sebastopol, Healdsburg, Sonoma and Petaluma are so small as to be somewhat misleading. The broad brush numbers are interesting and helpful in terms of assessing overall trends, but each location and property type is unique, so your particular results may vary. So what does this mean to you if you are a buyer? Home Sellers in Sonoma County are firmly in the driver's seat--if you are a buyer you are looking at visibly rising sales prices for almost everything priced under $600,000 or $700,000. At the higher price ranges, over $900K or a million, homes are selling extremely rapidly in many cases, often with multiple offers. You really need to team up with a good agent to succeed in this market, be fully pre-approved with a good lender, or have proof of funds if you are a cash buyer. You have to be realistic about what you are willing to spend and perhaps narrow your search criteria to something $50,000 or more under what you ultimately want to spend. It is not uncommon for homes to sell $50 to $100 thousand OVER asking, so adjust your search criteria accordingly. At the million plus price ranges the overbid can be more. A $1.2 million dollar property on West Dry Creek in Healdsburg came on the market and received 4 offers within the offer period and sold well over asking. The home was in a pretty setting with a pool but dated with lovely gardens. What does this mean to you if you are a Sonoma County Home Seller? It is possible your home may be worth more than you think. Hurray! Maybe you have more equity than you think. Maybe you have a reason to move--job change, downsizing, new baby on the way. This could be a great time for you to sell. It DOESN"T mean you can overprice your home. It will sell eventually and possibly for less,...
Local Sonoma County Business Confidence at a Six Year High, Led by Tech Firms
Every six months the Sonoma County Economic Development Board releases the results of it's survey of local business leaders. This winter, confidence is at a six year high--nearly making it all the way back from the very low confidence expressed (not surprisingly) in the winter of 2008....
Steady Decline in Homes for Sale Continues in Sonoma County, therefore Home Values are Rising!
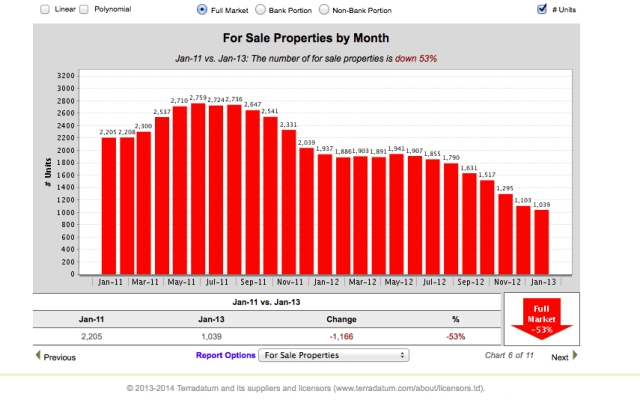
[caption id="attachment_2007" align="alignleft" width="300"] There are 53% fewer homes for sale as of February 1 than two years ago this time.[/caption] Each month I pull the Home Sale Statistics for Sonoma County. Each report has a dozen or so graphs and charts showing various aspects of our local real estate market. As I review them, I try to think of the one slide that says it all for that month. This month, it is the above chart showing the number of listings available throughout our county. Normally I show median price, months of inventory or active vs sold listings, but this month I thought I would cut right to the chase. We need more listings! Listings are typically low in January and February as home sellers and buyers haven't geared up for the spring and summer selling season. This year however buyers did not get the memo to take the holidays off! Most of the Bay Area agents I regularly talk to agree that this year we barely took a breath over the holidays and based upon January, 2013 looks to be a very strong year for our real estate market, one that continues to heal. Prices and values are rising. There are fewer and fewer distressed properties and rising home values are lifting more homeowners every month in to an equity position rather than an underwater position. This is all good news! But now potential sellers need to get the memo. Take a look at the graph above. In 2011 on January 31 there were 2205 homes for sale in Sonoma County. This there there were only 1039 available, a 53% decline. That represented declines in both bank-involved sales AND equity sales. When I look at our Multiple Listings Service on February 1, of those 1,039 homes for sale, only 592 were actually Active. The rest had already accepted offers and were either Contingent (working through loan, inspection and other contingencies) or Pending (waiting to fund and close.) So the actual number of homes available is much less than it appears. What does this mean? Home values are rising rather steadily, with the largest rises coming at the lower end of the market. I believe that sellers are starting to get the word, and we should see more inventory coming on the market at all price ranges in the coming months. If you were considering making a move, please call or...
Wine Country and Technology Team up to Drive Sonoma County Economic Growth in 2013
[caption width="480" align="alignleft"] The Sonoma County Harvest Fair Wine Competition, courtesy of Williamson Wines in Healdsburg[/caption] This morning I received the newly released Sonoma County Economic Development Board study of the Sonoma County economy, prepared by Moody's Analytics, a national economic research firm. Technology, led by the many medical device manufacturers in Sonoma County, wine and tourism (the wine country part) are strengthening and are expected to lead Sonoma County to grow faster than the state and national averages in the second part of 2013. These are all encouraging signs for a real estate market that continues to strengthen, and where values are at long last rising. Now all we need are more homes listed for sale! Now is not too soon to begin planning to sell or buy in 2013. Please email or call me with your questions, after New Year's Day. We are taking a short break now and look forward to working with you in 2013. Happy New Year! And take a peak at the report below, it has some interesting graphs and analytics. It likes back to my document collection at Scribd.com, where I have also posted the latest home sales statistics for the Sonoma County market through November 2012. Sonoma County Economic Development Report ...
Homes in Sonoma County Are Selling Twice as Fast This Year–We Need More Listings!
Sonoma County Home Sales Report through August 2012 The latest Sonoma County home sales figures through August 2012 show more of the same--increased rate of sales, a higher median price due to the addition of more expensive sales and more non-distressed (equity sales) in to the mix as well as significantly fewer listings than a year ago. The result? Homes that sold in over a hundred days a year ago are now selling in 54 days! Given that more homes also went in to contract in August than any month in the preceding THREE YEARS (!), it seems likely that the decline in inventory and increase in sales are trends that will continue for at least the next several months. The upcoming presidential election does not seem to be factoring in to most of my clients' thinking here in Northern California. Here is the full set of reports. Please email or call if you have any questions about this data or real estate in Sonoma County. The link will take you to a PDF of the full document at my Scribd page. There you can see all the of the reports I have done in recent years. ...
Pending Sales for July up to Highest Rate of 2012 while Homes Inventory Declines 39%
The rate of home sales in Sonoma County continues to rise, and inventory is dropping even faster. Here is a detailed set of market statistics for Sonoma County from July 2011 through July 2012....
All Signs Point to Rising Home Values in Sonoma County and the Bay Area
The number of homes for sale in Sonoma County is the fewest in many decades, according to a panel of real estate appraisers who recently presented their thoughts at the North Bay Association of Realtors' weekly breakfast meeting in Santa Rosa. At the end of May of the 1900 homes technically available on our MLS, over 1,000 were already in contract, leaving only 900 homes available. This was roughly a forty percent drop from last May. Inventory is declining due to a steady increase in new and pending sales, documented here. Interest rates are ridiculously low and buyers at all price ranges conitnue to leap off the sidelines. Appraisals are often a challenge now as the market is moving too fast and overbids in pending sales are not yet reflected as SOLD data, creating large challenges for the 70% of buyers who are applying for home mortgages today. All signs point to gradually increasing home vales. Decreasing supply and increasing demand. Part of this may be attributed to the "Facebook" effect, much touted for months even before Facebook's beleaguered IPO earlier this spring. The IPO and generally strong tech economy are lifting the Silicon Valley and San Francisco housing markets to red hot levels. I was in San Francisco this morning for a seminar on real estate legal topics and heard some interesting stories that are coming out of this frenzied market. Many properties, even in the six to twelve MILLION dollar range are receiving multiple cash offers. What happens when some buyers lose out--they get creative. It is increasingly common for losing Buyers to offer cash incentives to the buyers in first position (the winning buyer) so that they will assign their rights to buy the home to the frustrated loser. How can this happen? Most standard real estate contracts are assignable, unless specifically amended. In one case winning buyer accepted $100,000 from a losing buyer to assign their right to purchase a home to the second buyer. Can you imagine how the seller feels seeing that $100,000 go to some one else? Needless to say this creates some interesting challenges for sellers and their agents to be aware of--that is why the good brokerages such as Wine Country Group, my firm, offer continuing legal education to their agents. ...


